
DP Mobility Report: A Python package for quick explorations and mobility data reports with privacy guarantees
Alexandra KappExploratory data analysis is an essential step in any data science project, as it allows us to understand the data and identify patterns, trends, and anomalies. However, exploratory analyses can often be time-consuming and repetitive. While there are existing packages for performing exploratory analyses on tabular data, e.g., ydata_profiling (formerly known as pandas_profiling) for Python, this is not perfectly suited for mobility data. For example, spatial data is best explored on maps, instead of histograms of latitudes and longitudes. This is where our newly developed dp_mobility_report Python package comes in, which takes a mobility dataset as input and outputs a comprehensive report as a HTML file with common explorations used for mobility data. (Note, that this package is directed at human mobility data on an urban scale.)
The report should not only provide exploratory analyses but also allow the sharing of reports with third parties, thus, we also want to ensure privacy. While aggregations can be used to provide some level of privacy, they may not always be sufficient. Our Python package addresses this challenge by providing differential privacy (DP) guarantees (if you are not familiar with differential privacy, you can find more information in our documentation). This ensures that the report can be safely shared within an organization and with third parties while maintaining the privacy of the data.
An example of an HTML DP Mobility Report output can be found here.
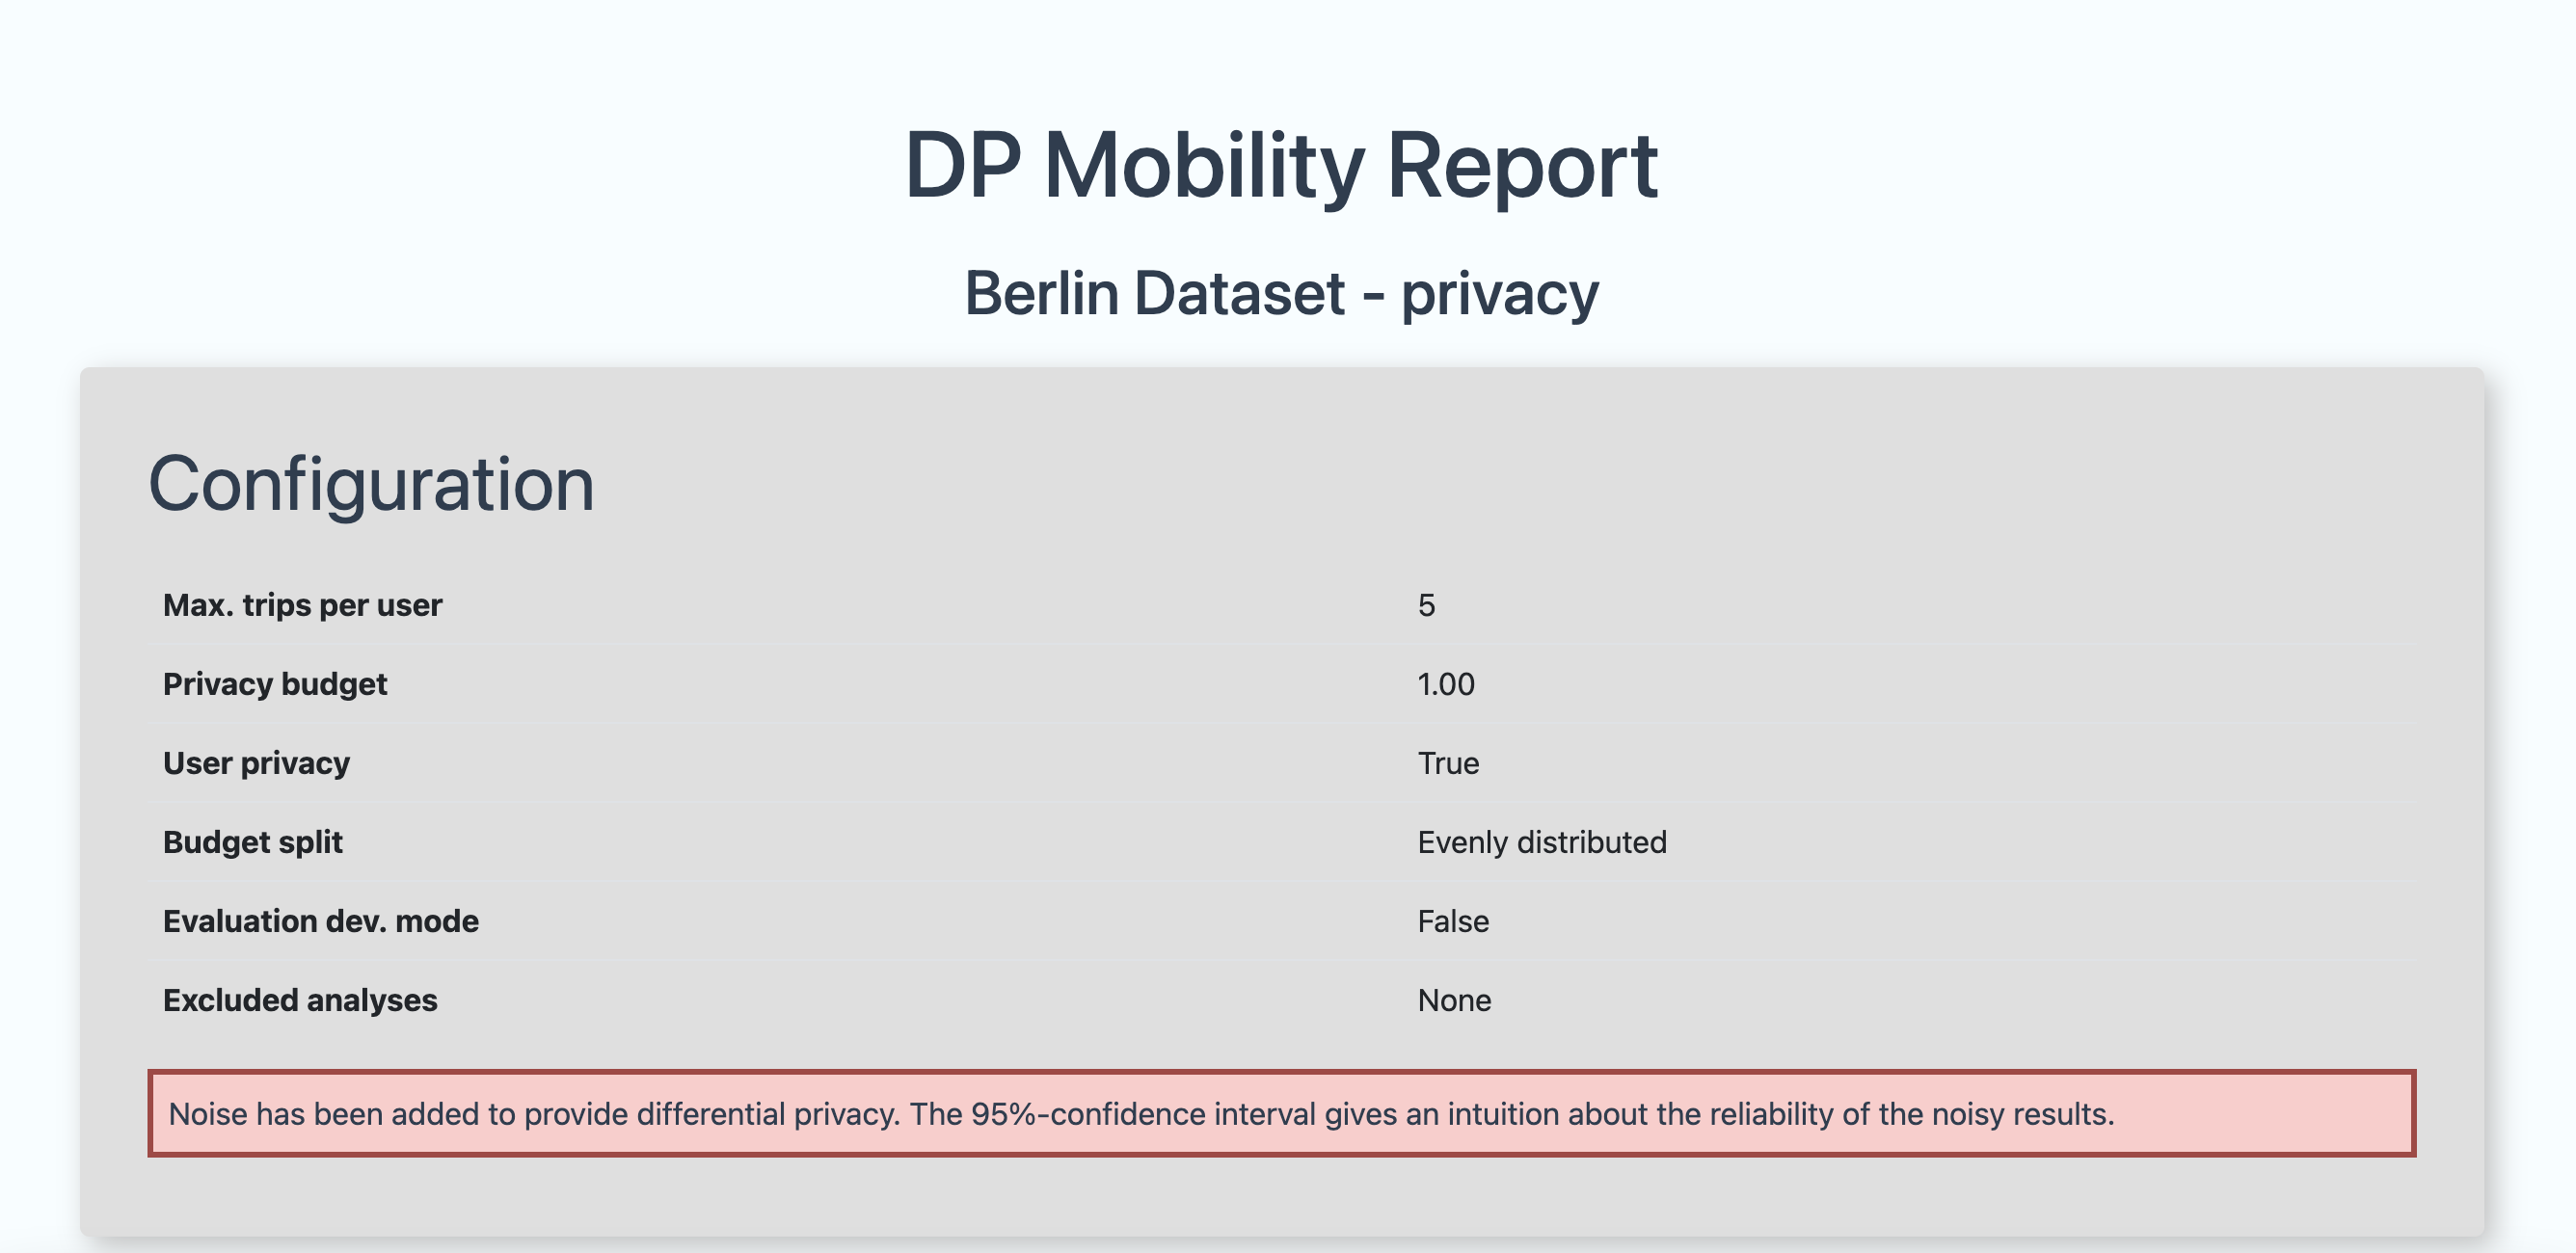 Screenshot of an example DP Mobility Report
How the report works
Essentially, the report takes the dataset as input, computes the aggregations and applies noise according to differential privacy and outputs an HTML file with a DP Mobility Report.
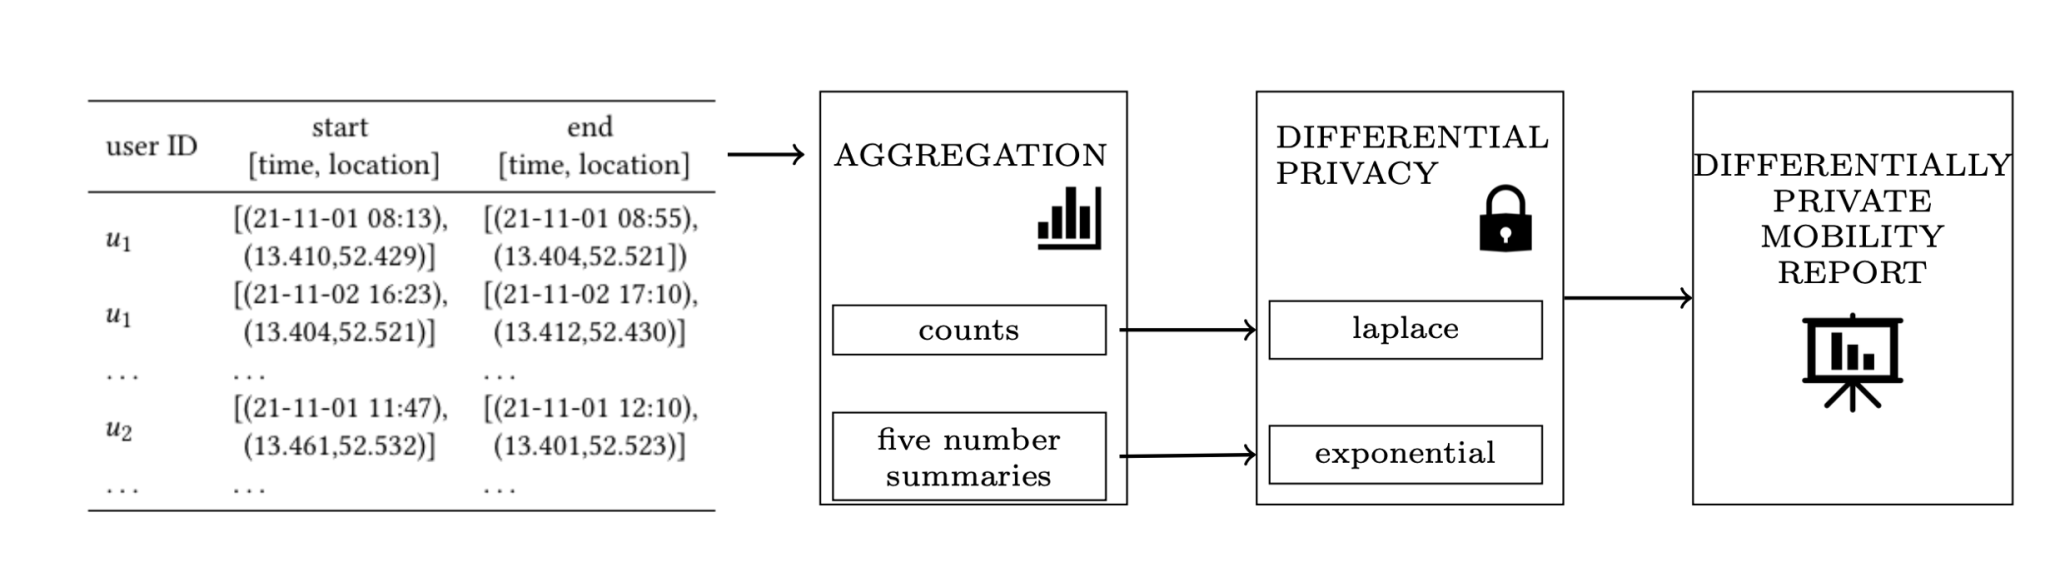 High level scheme of the creation of a DP Mobility Report
Input data
The input data format is expected as follows: a pandas DataFrame with the columns user id (uid), trip id (tid), timestamp (datetime), latitude (lat), and longitude (lng). Only staypoints, i.e., start and destination, are considered. If the dataset set also contains waypoints for a trip, they will not be evaluated in the report.
Additionally, a tessellation is expected as a geopandas GeoDataFrame. This can either be custom defined, like administrative boundaries, or regular grids.
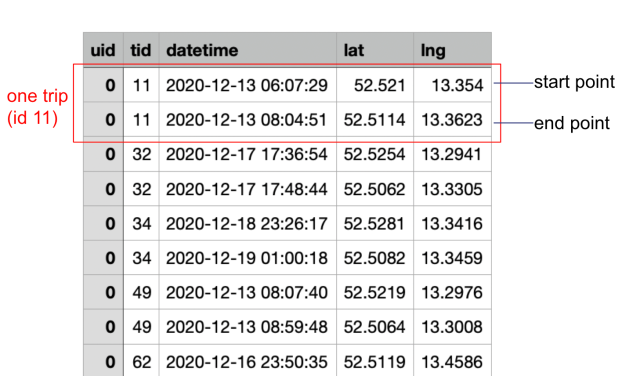 Example input mobility data
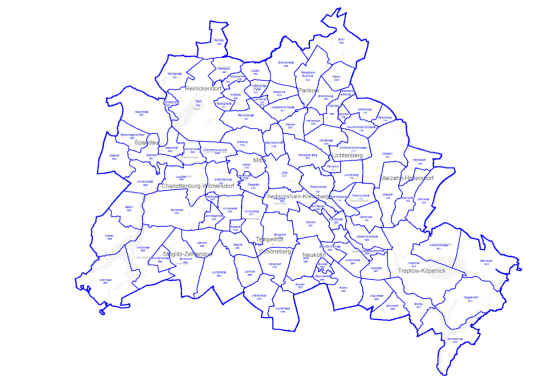 Example input tessellation (Source: Geoportal Berlin)
Code example
After installing the dp_mobility_report, the dataset (df) and tessellation need to be provided as input parameters for the DpMobilityReport class. To provide differential privacy, the privacy_budget can be set accordingly.
With the report.to_file() function, the report is created as HTML and stored at the given path.
import pandas as pd
import geopandas as gpd
from dp_mobility_report import DpMobilityReport

df = pd.read_csv("input.csv")
tessellation = gpd.read_file(
                    "tessellation.geojson"
               )


report = DpMobilityReport(
    df,
    tessellation,
    privacy_budget=5)

report.to_file("my_mobility_report.html")
Customizing the report
The default settings of the report may not provide the optimal output. With the following parameters, the report can be enhanced:
- Max. trips per user: To provide differential privacy on a user-level (in contrast to the much weaker guarantee of item-level), noise is calibrated according to the maximum possible contribution a user can make. Intuitively, if 90% of a the dataset consists of trips of a single user, much more noise is needed to ‘hide’ them in the crowd in contrast to a person that is only contributing 1% of the data. This leads to the phenomenon, that only using a sample of the dataset, in comparison to the entire dataset, results in less noise and likely a higher utility (You can find more in-depth information and evaluations on this in our paper.) To limit the contribution of single users, the parameter max_trips_per_user can be set accordingly. The parameter user_privacy can be set to False, if only item-level privacy is desired (default: user_privacy=True).
- Analysis selection: To provide differential privacy, the given privacy budget needs to be split between all analyses. This means, the more analyses the fewer budget for each analysis and thus, the more noise. To save privacy budget for needed analyses, all analyses that are not relevant for this dataset should be removed with the analysis_exclusion parameter (alternatively, analyses can be specifically included with analysis_inclusion)
- Privacy budget split: Highly aggregated analyses, for example, the overall count of trips, are more robust to noise while more disaggregated analyses, for example, origin-destination flows, are more sensitive to noise. Therefore, it makes sense to not split the budget equally over all analyses, but instead, to use more budget for certain analyses. With the parameter privacy_budget_split the share for each analysis can be adjusted. (Per default, each analysis gets a weight of ‘1’. If a weight of, for example, ‘100’ is set for an analysis, this means, that it gets 100 times more privacy budget than the analyses with weight 1. It can also be set below 1; a weight of ‘0.5’ means only half as much privacy budget is assigned.)
- Custom histogram bin ranges an max. values: Automatically generated histograms likely do not have “nice” breaks. If a distribution has a long tail, it might also dominate a histogram. To create more meaningful and nicer histograms, there is a parameter for each, that let’s you define the bin range and maximum value. For example, bin_range_travel_time=5 and max_travel_time=90 shapes the travel time histogram such that each bin covers 5 minutes and everything above 90 minutes is summarized to a bin “>= 90”.
Here you can find the full DpMobilityReport documentation.
from dp_mobility_report import DpMobilityReport, constants as const

report = DpMobilityReport(
               df, # the pandas DataFrame input data
               tessellation, # the tessellation as GeoDataFrame
               privacy_budget=50, # privacy budget to provide differential privacy
               max_trips_per_user=5, # limits the contribution of a user
               analysis_exclusion=[const.USER_TIME_DELTA], # exclude analyses
               #analysis_inclusion # can be used instead of anaylsis_exclusion
               budget_split={
                    const.VISITS_PER_TILE: 100,
                    const.VISITS_PER_TIME_TILE: 300,
                    const.OD_FLOWS: 500}, # custom split of the privacy budget
               timewindows=[2, 6, 10, 14, 18, 22], # hours defining time windows
               max_travel_time=90, # in minutes
               bin_range_travel_time=5, # in minutes
               max_jump_length=10, # in km
               bin_range_jump_length=1, # in km
               max_radius_of_gyration=10, # in km
               bin_range_radius_of_gyration=1, # im km
               max_user_tile_count=8,
               bin_range_user_tile_count=1,
               #max_user_time_delta,
               #bin_range_user_time_delta,
               subtitle="Test Report" # provide a meaningful title
          )
Benchmark report
The package also provides the option to compare two datasets with one another (referred to as ‘base’ and ‘alternative’ dataset). Either, the same dataset with different parameters (e.g., one with and one without privacy budget), or two different datasets (e.g., a synthetic dataset and its original counterpart).
For each analysis, a visual comparison is provided, as well as similarity measures, that quantify the difference between the two datasets (please refer to the documentation, for more information on similarity measures).
An example for the HTML benchmark report output can be found here.
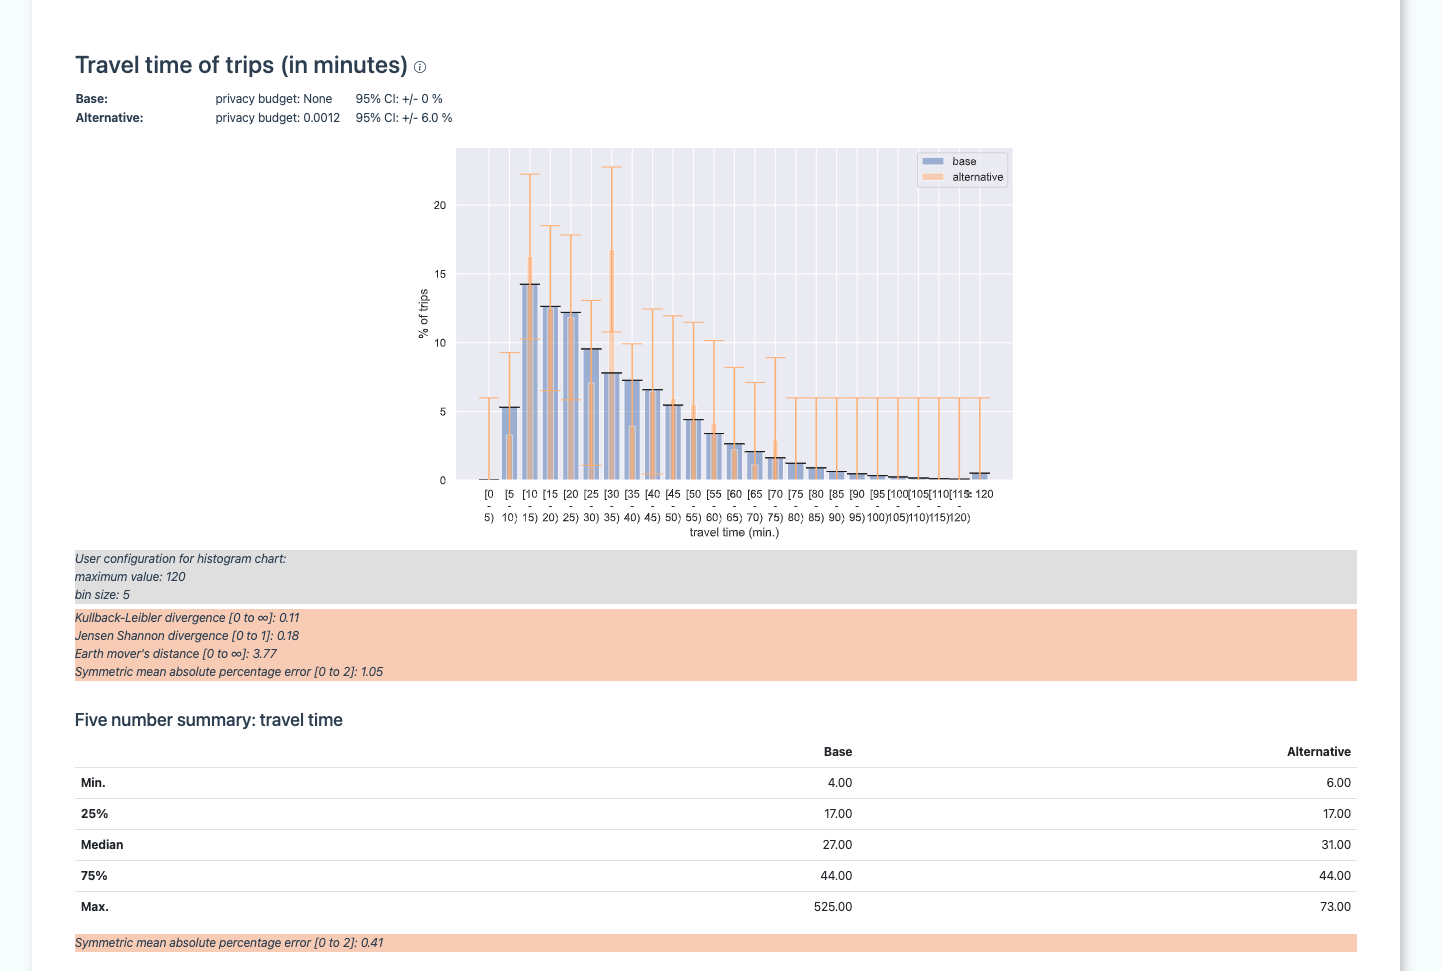 Example excerpt of the benchmark report for the analysis “travel time”
Creating a tessellation
If you don’t have a tessellation at hand, here is a code snippet that helps to create a grid as a tessellation. You only need to provide the min. and max. latitude and longitude values of the desired bounding box.
Feedback
We are always happy about feedback! If you find this package useful, encounter bugs or have recommendations for further enhancements, feel free to reach out via e-mail or open an issue!
Links
Github Repository: https://github.com/FreeMoveProject/dp_mobility_report Documentation: https://dp-mobility-report.readthedocs.io PyPi: https://pypi.python.org/pypi/dp_mobility_report
Dieser Text erschien zuerst auf Alexandras privatem Blog.